
Over the time, starting 2012 with my implementation career on ServiceNow (Berlin release back then), I was able to understand how ServiceNow actually works under the hood and how all the little and larger gears engage with each other and which technology is used where. And there are a lot of smaller and larger bits and pieces!
Intro
I’m thoroughly examining every ServiceNow release (since the Fuji release even based on the distribution files used to install/upgrade/operate ServiceNow instance nodes) and I noticed quite a big development within the Product as well as the Company with each major release — friends working in (pre-) sales might relate with the changing licensing models as well.
Also the documentation (both for developers as for the actual product configuration) got better and more extensive with the time and illustrates the growing complexity of the product as well.
This is also well reflected by the available certifications (e.g. for the Certified Implementation Specialists).
And since I’m a huge fan of facts and figures and I love programming and examining things, I wondered if I could quantify the complexity and visualize it with something like a city map of scriptable classes and their references between each other in a picture.
API Universe (of scriptable (Java) Classes)
Based on the information I had available I was able to create a network (nodes and edges) of scriptable (Java) Classes. My actual idea behind this was to enhance the accessibility of the information available in the Developer Reference a bit more by providing a clickable visualization of which class is referenced where (e.g. as an input or an output of a method/function or by being in a direct relation within the inheritence tree). My next idea was that this network must be weighted with the most referenced classed in the center to generate a realistic emphasis on the most used classes.
Basically this was based on my idea of visualizing the overall database structure of ServiceNow, but this time just for the program/source code structure.
Turned out, the network was far too big to be efficiently usable — I already had to apply some tricks for the Data Model Explorer back then, but this time I would have needed to go even further with a much more static approach, rendering it basically useless for a dynamic usage in an average desktop browser setup.
As a side note: I built two versions of the network, one even involving the individual methods/functions as own nodes… you can imagine performance-wise this is even worse than having a consolidated view just on the class-to-class level as pictured below.
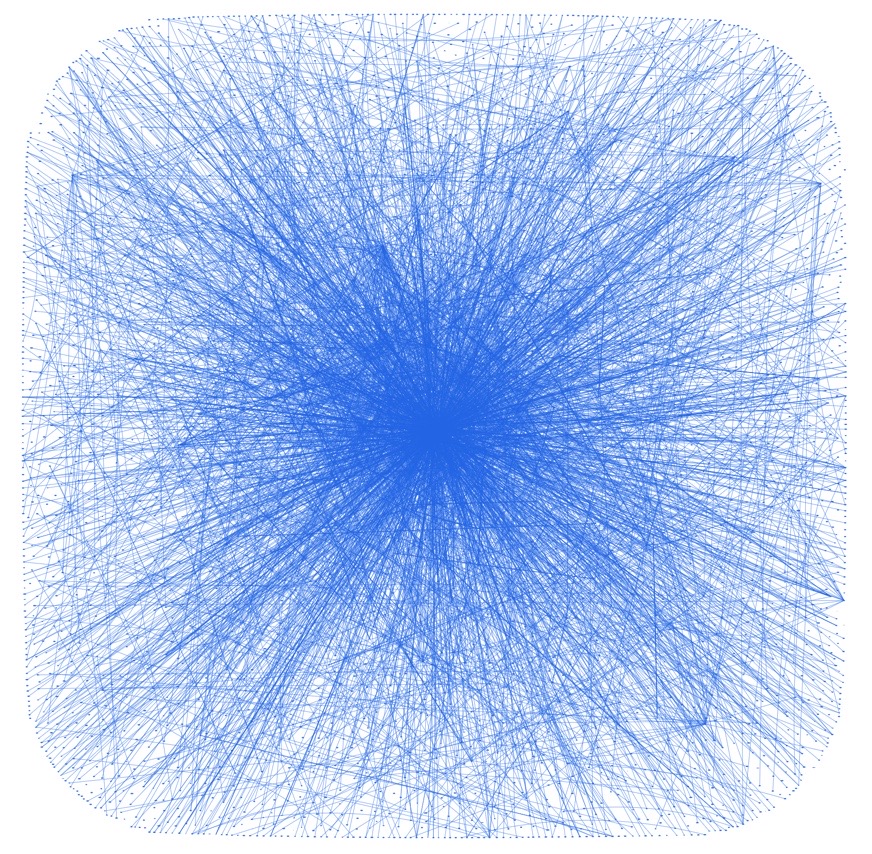
Of course the GlideRecord is the “gravity center” of the whole API; it’s the most referenced Class as you could imagine. It’s followed with a huge (absolute) distance by the ScopedScriptableObject which is a base Class to many of the available API objects.

First glimpse into the past
As I knew the distribution file was growing with each release, I wondered how ServiceNow would have developed in terms of usable (scriptable Java) API and other measures.
But first let’s quickly have a look at distribution file size as this is easily thrown into a graph:
This graph made me confident I could pull some more information out of the data that was available to me and somehow already resembled what I felt about the development of ServiceNow’s complexity.
How to measure more information
I thought about which information I was able to extract further and came up with the following measures:
- number of scriptable (Java) Classes
- number of Properties (GlideProperty)
- number of Plugins
- number of pages in the ServiceNow Docs
But how to measure? For the docs this is quite easy: crawl the whole available documentation per release. I had experiences with programming my own scrapers in the past in various programming languages, so this was a piece of cake for me.
For the rest I needed to work my way through the distribution files and created a whole workflow to extract and recognize scriptable Java Classes, referenced Properties in all Java Classes, and Plugins, which would be exported into different files (e.g. a file including all nodes and edges for the network mentioned above).
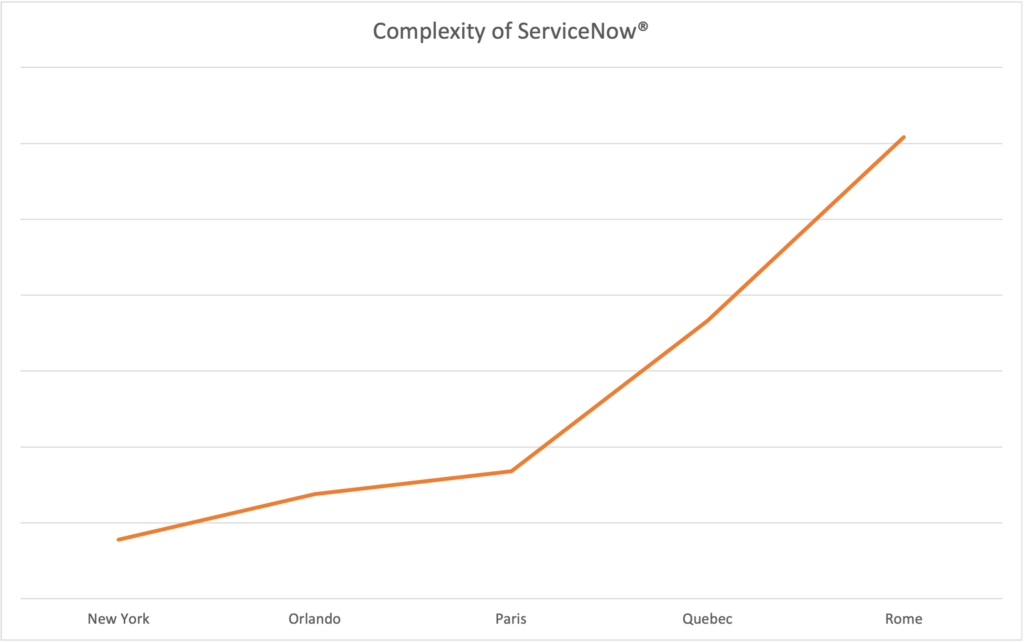
Development of the complexity
Not quite the development I was expecting, but still I can relate this to my gut feeling. ServiceNow seems to develop steadily with each major release. Also with this type of visualization I tend to just recognize the relative growth and trend.
Zoom In, Focus
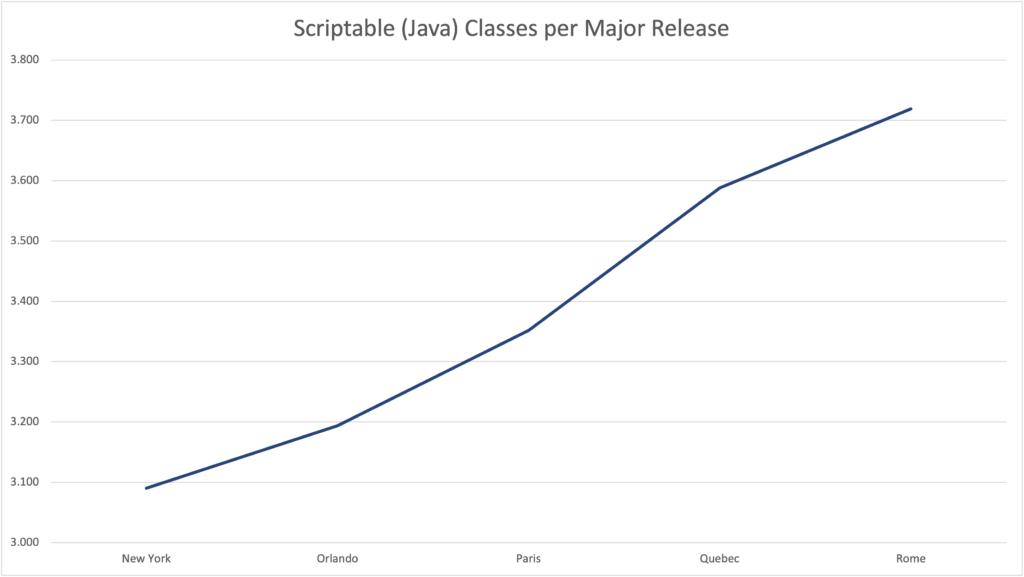
Still, when we look at the absolute numbers (like over 150 new scriptable (Java) Classes per Major Release on average) it is really impressive how much ServiceNow grows with each release.
When just looking at Releases New York to Quebec, we might recognize something like an exponential growth in the number of scriptable (Java) Classes which resembles my gut feeling a bit better, but of course we are only looking at a very small sample!
What’s missing
What’s of course missing, is data prior to the New York release (e.g. as documentation isn’t available anymore). With data from earlier releases we might get a much clearer image of the overall development. Also we are just looking at scriptable (Java) Classes, leaving out all the scriptable Classes made available by Script Includes and leaving out the overall number of Java Classes. Both might give a better understanding but weren’t part of my initial examination.
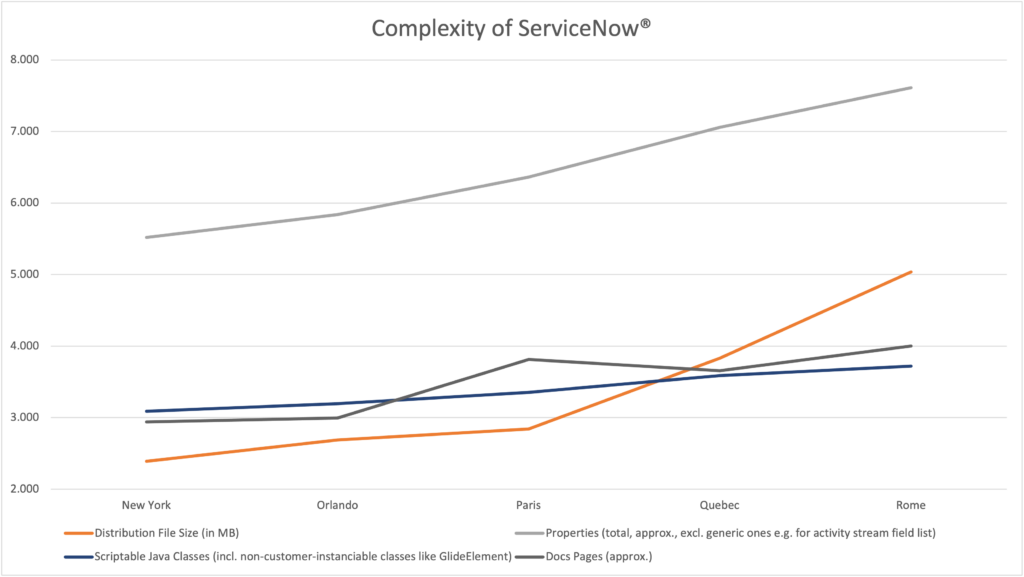
Consolidated data extracted
| New York | Orlando | Paris | Quebec | Rome | |
| Distribution File Size (in GB) | 2.39 | 2.69 | 2.84 | 3.83 | 5.04 |
| Properties (approx. total, excl. generic ones e.g. for activity stream field list) | 5,519 | 5,839 | 6,365 | 7,060 | 7,612 |
| – thereof documented for customer usage (approx.) | 771 | 778 | 886 | 877 | 939 |
| Scriptable Java Classes (incl. non-customer-instanciable classes like GlideElement which is available via GlideRecord fields) | 3,090 | 3,194 | 3,352 | 3,588 | 3,719 |
| Plugins (incl. plugins not directly available to the customer) | 1,520 | 1,708 | 1,857 | 2,075 | 2,109 |
| Docs Pages (approx.) | 2,941 | 2,994 | 3,815 | 3,656 | 4,003 |
Epilog
This time I wasn’t able to offer you another tool like the Data Model Explorer, but I still hope I was able to transport interesting information and insights. Of course this isn’t much valuable information you’d need for an actual implementation, but it has the potential to show where the journey of ServiceNow goes — and that there is a good reason for re-certifications.
Also I think, I will have a phone case printed with the picture of the “API universe”.